Using Dashboard
Every aspect of the TableOS Dashboard documented in detail.
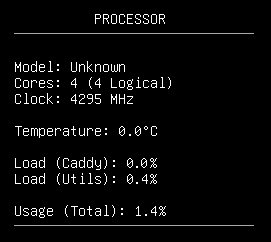
Processor Panel
-
Model: The model of CPU installed in your computer. Depending on your hardware this may not be detected properly, as some older processors don't always report the this information.
-
Cores: The number of physical and logical cores (threads) your CPU has. The more of these you have, the more things your computer can work on at once.
-
Clock: The current speed at which your CPU is running in megahertz (MHz)
-
Temperature: The current temperature of your CPU as reported by hardware in degrees celsius. (Depending on your hardware, this value may display 0.0 if your hardware doesn't report it properly to the linux kernel)
-
Load (Services): How much of your total CPU utilization is due to a specific service/process.
-
Usage (Total): Current total CPU utilization as a percentage. This can be thought of as how busy your processor has been over the last couple second.
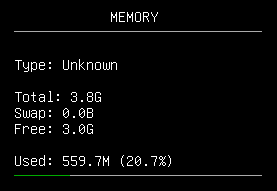
Memory Panel
-
Type: The generation of random access memory (RAM) support by your computer, such as DDR4 or DDR5. Each generation represents roughly a 2x increase in bandwidth over the previous.
-
Total: The total amount of RAM you have installed
-
Free: The amount of your RAM that is not currently reserved for use.
-
Swap: In the event that you run out of RAM, your computer will start storing system memory in a special place on your primary disk called swap space. This allows your computer to continue working instead of crashing, but the disk is significantly slower than RAM so your server's performance will be degraded.
-
Used: The amount of your RAM that is currently in use.
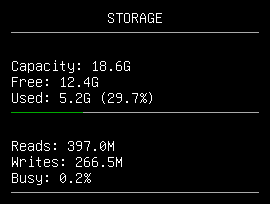
Storage Panel
-
Capacity: The total size of your primary drive.
-
Free: The amount of space available on your primary drive.
-
Used: The amount of space currently consumed by data on your primary drive.
-
Reads: The total amount of data read from your primary drive since last reboot.
-
Writes: The total amount of data written to your primary drive since last reboot.
-
Busy: The current utilization of your primary drive as a percentage.
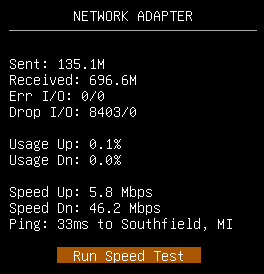
Network Panel
-
Sent: The total amount of data sent over the network since last reboot.
-
Received: The total amount of network errors encountered since last reboot.
-
Err I/O: The total number of incoming and outgoing packets that have been dropped since last reboot.
-
Usage Up: How saturated your upload bandwidth is. Calculating this number requires a speed test to have been run.
-
Usage Dn: How saturated your upload bandwidth is. Calculating this number requires a speed test to have been run.
-
Speed Up: How fast you can send data over the internet as measured by the speedtest servers. (Your upload bandwidth)
-
Speed Dn: How fast you can receive data over the internet as measured by the speedtest servers. (Your download bandwidth)
-
Ping: The latency or delay measured between you and the speed test servers. You want this to be as low as possible, especially for game servers. Always prefer a hardwired ethernet connection instead of WiFi whenever possible. It's far superior in terms of latency, and will make your server more responsive.
-
Run Speed Test: This button will determine the closest test server, then trigger a network speed test.