Using Dashboard
Every aspect of the TableOS Dashboard documented in detail.
Service Panels
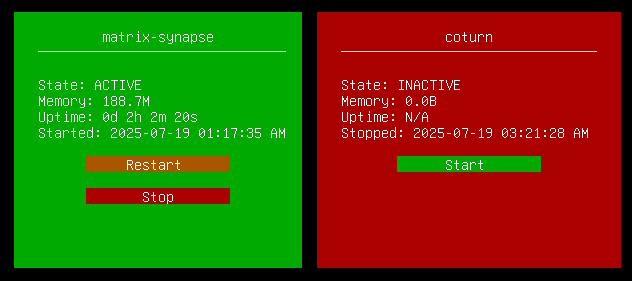
Service panels display the status of a core service required for the operation of your server. Which specific ones are displayed will depend on what software you've deployed. Generally you will see one for each software feature you deploy, although some software depends on other services to function, in which case those will have their own service panels displayed as well.
-
State: The current state of the service. Active means that the service is running properly. Inactive indicates that the service was either stopped manually, or an issue is preventing the service from starting.
-
Memory: How much random access memory (RAM) this specific service is currently using.
-
Uptime: How long this specific service has been active for. This will reset if you restart the service or reboot your server.
-
Started/Stopped: The timestamp when the service was last started or stopped.
-
Start/Restart: This button attempts to start or restart the service depending on if it was already active or not.
-
Stop: This button will stop the service, freeing any memory it was consuming. Whatever application this service was related to will stop functioning until you start it again.